As a Web developer or IT team member, you can never have too much data detailing the performance of your website and how it compares to others across the industry. One simple way to understand how your website performance compares to a cross sampling of the internet takes just three steps:
- Run a Web performance baseline on your site using a tool such as Dotcom-Monitor’s Website Speed Test.
- Run a query on the top 100 or top 1000 websites using the tools on the HTTPArchive.
- httpsArchive.org
- Compare the data to see where you stand against the industry.
This gives you great insight into general web performance analytics and averages, but you can’t dig into the details. The dataset captured by HTTP Archive is enormous, well over 400 GB. However, if you thrive on shaving milliseconds from a page load time, you want access to the most data possible.
Web Performance Analytics at Your Fingertips
Now, the full HTTP Archive dataset is now available on BigQuery, a Google tool that lets developers or anyone else interested in comparative analytics analyze big data in the cloud. Users can run SQL-like queries against huge datasets and get results in seconds. Now you can dig in to the detailed web performance analytics data and discover insightful nuances on website performance yourself. If you haven’t tried this out already, you’re missing out; you can crunch Web performance numbers to your heart’s content, and get in-depth analysis of where your site fits into the mix.
For example, you can run really basic queries on huge sets of data and receive results immediately. We ran one query to determine the top 10 most popular content distribution networks with the following query:
[note note_color=”#e7e7e7″]SELECT cdn, Count(cdn) as Count FROM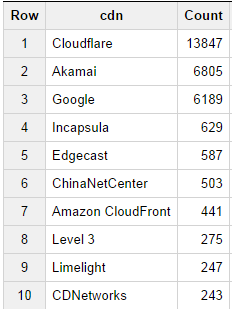 [httpsarchive:runs.2014_09_01_pages] WHERE cdn <> “” GROUP BY cdn ORDER BY Count Desc;[/note]
which returned the following results:
When thinking about the most referenced CDNs, we also wondered what sites in general host the most referenced material (such as tracking code for analytics etc…) so we ran the following query to retrieve this information:
[note note_color=”#e7e7e7″]SELECT DOMAIN(req.url) Most_Referenced, COUNT(*) Total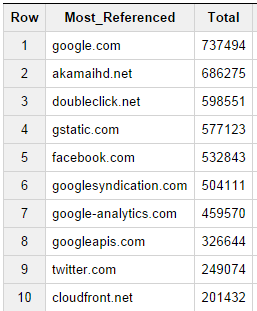
FROM [httpsarchive:runs.2014_09_01_requests] as req JOIN (
SELECT DOMAIN(url) self, pageid
FROM [httpsarchive:runs.2014_09_01_pages] ) as pages ON pages.pageid = req.pageid
WHERE DOMAIN(req.url) != pages.self
GROUP BY Most_Referenced
ORDER BY Total desc;[/note]
Not surprisingly, we see several of the forerunners showing up on both lists as Google, Akamai and Amazon cloudfront are all widely used as both hosts of content as well as additional referenced elements.
This data may not be much of a surprise to anybody, but these queries really just touch on the tip of the iceberg. You can write more complex queries to really dig into the web performance analytics data and identify content relevant to performance metrics that most interest you.
Even better is the ability to use a spreadsheet as your front end to that big data processing power. BigQuery now interfaces with Google Docs, allowing users to see and share results quickly and easily—with the boss, interested coworkers and more.
Here is a great video from Google Developer Advocate Ilya Grigorik at Velocity last year that details exactly how to get started using HTTP Archive Data on BigQuery. Don’t forget: The first step is to get your baseline Web performance test for your own website so that you have benchmarks to compare your own web performance analytics to the rest of the internet.