Web Stress, Slow Websites & Your Brain [INFOGRAPHIC]
Is your slow website giving your customers “web stress”? Studies show 57% of online consumers will abandon a slow page after just 3 seconds.
Is your slow website giving your customers “web stress”? Studies show 57% of online consumers will abandon a slow page after just 3 seconds.
Website Performance Test
As one of the world’s most important sporting events the Olympic Games attract millions of people from around the world. The mass media websites that cover the Games must be able to work under unprecedented loads of traffic. The Dotcom-Monitor team decided to take the opportunity to run a website performance test analyzing how the most powerful mass media websites respond to this massive influx of website visitors during the Olympic Games.
We setup website performance monitoring using two Dotcom-Monitor solutions: ServerView and BrowserView Platforms.
We test Facebook website speed and page load time from around the world to see how Facebook handles their massive amounts of web traffic.
We ran a website speed test on the websites covering the Euro 2012 games. See how the top media sites ranked in this website speed Infographic.
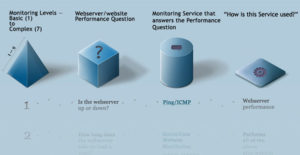
Website monitoring and escalation is a very complex process that involves multiple variables. Not surprisingly, some people found it challenging to understand…and even more challenging to explain to others. This Infographic explaining the process, including the various monitoring tools for each level of monitoring from “basic” to “complex”.
Deep within the very heart of your body, lurks a force so intrusive and so powerful that it would terrify you if you came face to face with it. Your backbone – which is, in fact, many bones that together hold your skeleton and the rest of your body together.
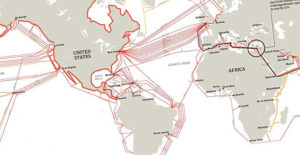
The Internet also has a backbone. And just like your backbone, the Internet backbone holds the Internet together – a network of high capacity communications routes linking local Internet networks (comprising over 35 million Internet server sites) across land and under the sea. Here is a quick look at the Internet backbone.