User Interface Update:
There are several exciting new features along with some updated cosmetic changes to the Dotcom-Monitor user interface.
Here is a brief overview of the changes:
- The color scheme has been updated to make the site easier to read.
- On the Device Manager (The first page you see when you log in), you can now see the details of the packages you have purchased, including the maximum monitoring frequency and # tasks available / total tasks purchased.
- The Device Manager now displays DOWN when the status of a device is down based upon the schedules and filters you have applied to the device
Dashboards
View the current status of your monitored devices along with recent events and response times using the new dashboards.
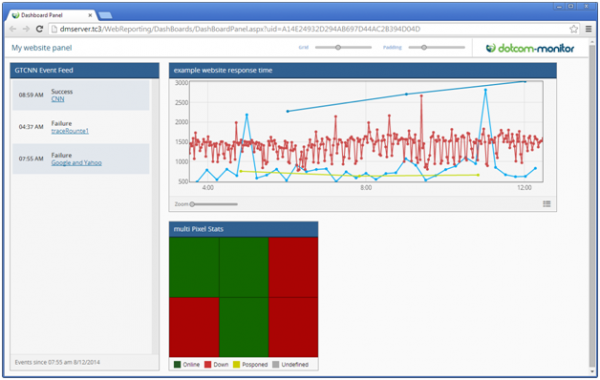
The dashboards are accessible via a unique GUID based URL and usable on desktop and mobile platforms. Create multiple customized views of:
- Response Time – line-graphs display recent response times
- Up/Down status – color-coded pixel grid displays up/down device status
- Events – Table displays recent changes in device Status, configuration changes, alerts, and state changes
With the new dashboards you can now:
- Create multiple dashboard panels to organize and view the data how you want to see it.
- White label the dashboard to display your own logo
- Share the URL of a dashboard with anyone by simply copying and pasting the URL into an email or document.
Report cards are now considered a type of dashboard, so the report card configuration has moved under the configure menu in the dashboards section.
You can find more information about the dashboards in our knowledge Base.
Visual Traceroute
Diagnose errors faster with a hop-by-hop visual representation of network traceroutes when an error occurs. The Visual Traceroute tool helps you quickly determine whether your issues are affected by network performance or not.
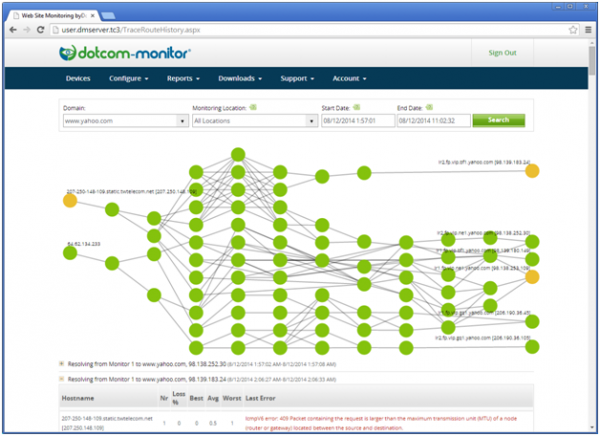
Previously, when troubleshooting an error, you could view a detailed traceroute from the time of the error. Now when you click on the traceroute you will see a visual representation of the traceroute along with configuration options to view the paths of multiple traceroutes from recent events.