Did you know that you don’t have to log in to the Dotcom-Monitor website to access your monitoring data? We have several options that allow you to interact with and consume your monitoring data in the format that best fits your needs.
In addition to the email, sms text messaging and phone call alerts,
- You can set up scheduled reports via email
- Create and share Online Report Cards and Dashboard Panels
- Interact with the API
- Submit requests to the XML feed.
New XML feed Options
The XML feed gives you the power to consume your data in the manner of your 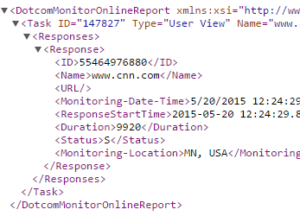 choosing, whether that is a custom dashboard designed in-house or an off-the shelf product or service. The XML options allow you to aggregate data in hourly, daily, weekly, monthly, and yearly summaries, and you can chose to simply pull uptime data or you can request complete element level response time data. For more information on all of the options available when using the XML feed, visit our Knowledge Base and navigate to the xml feed in the left hand navigation or type in a search string into the search field.
In addition to the existing options available in the XML feed, we have just released two new options for pulling detailed data from your Dotcom-Monitor account.
Return the Latest Response Via XML
One new option is to return the latest response reported from each device. This is useful when you don’t necessarily want to specify a date and time range, and you have different devices monitoring at different frequencies from one minute monitoring to once every three hours.
Here is an example using the xml feed to return the latest response:
Monitor Device Status Via XML
The second new option is returning the current state and status of a device (up or down, and active, postponed or no tasks). This is useful for updating a visual dashboard similar to a stoplight- if you don’t necessarily care about how fast the website responded to a request but you simply want to know if it did response successfully, then you could use the following call:
https://www1.dotcom-monitor.com/reporting/xml/status.aspx?pid=95478A5A3ECD4F5FB190ADBB7F79E462&Site=58031
In addition to these new features available when using the xml feed, there are a number of parameters available to gather specific information about your own monitoring results. Read the article on using the xml feed in our knowledge base to further understand the power of the dotcom-monitor system.